Interpreting Outputs
Interpreting outputs of WEPS is an important part of controlling
wind erosion through conservation planning. By observing how the
soil loss is affected by weather and field conditions, the
management operations can be adjusted to reduce soil loss. In
developing new conservation plans, the user should build or modify
several different scenariosand compare outputs to determine the
best management to control wind erosion. Because of runtime issues,
it is recommended that, for early comparisons, no more than five
rotations cycles be used for a simulation. This will allow relative
soil loss values for comparisons. Once one or two scenarios are
selected, more rotation cycles are recommended for more accurate
erosion loss estimates. The number of erosion cycles can be set by
selecting "Configuration" then "WEPS Developers Options" menus on
the main screen.
The following section outlines the content of the "Output Details"
screen.
Date
This column contains the start and end date of the period for which
the row information is reported (start day-end day month rotation
year). Items in each row represent values from the end of the
previous period to the current date. The date column, along with
soil loss, will indicate which periods have the greatest wind
erosion and are thus in need of changes of management to control
wind erosion.
The rows in the Output Details screen vary
depending on the number of cropping years in the rotation and the
number of management operations in each year of the rotation.
Each year of the rotation has output displayed for the first two
weeks and the 15th to the last day of each month as well as for
each management operation date. This output allows the user to
view the erosion and other output for each year of the rotation.
At the end of each year in the rotation is a row which contains
the average annual value for that rotation year. The last row
in the output form contains the average annual values for the
complete crop rotation
Operation
This column contains the management operation which occurred on
the specified date. It is the management operation or the date
of operation which most users will modify to affect field
conditions and thus wind erosion.
Crop
This column lists any crops planted on the date shown. Crop is
obviously another choice which the land manager may change to
control wind erosion.
Wind Erosion
The Wind Erosion columns provide a summary of all the wind erosion
soil loss for the simulation run. The numbers in these columns are
those that the user will try to affect by adjusting management dates
and operations. If an erosion event occurred but values generated
by the model are too small to be displayed on the output table
(e.g. < 0.001 k/ m2), then the amount is listed as "trace".
If amounts are to large to be accurately displayed then the amount
is listed simply as greater than (i.e., >) a specified amount. In
these cases erosion amounts are so large that they are generally
unacceptable.
Average Total Gross Soil Loss
This column contain the gross erosion within the field, averaged
across the field as well as averaged over the number of simulation
years in each rotation year (kg/m2 or tons/acre).
Net Soil Loss from Field
These columns contain net soil loss from the field averaged over the
number of simulation years in each rotation year (kg/m2 or tons/acre).
Some deposition within a field can occur especially when barriers are
present downwind. Net soil loss is the amount of gross loss minus
deposition. Total is the average total net loss from the field;
Creep/Sal is the average creep plus saltation net loss from the field;
Susp is the average suspension net loss from the field; and PM10 is
the average PM10 net loss from the field.
Mass Passing Field Boundary
These columns  contain the mass per unit length of various sized material which
passed the field boundary for each direction (kg/m or tons/1000 ft).
This information is useful in determining how much material is leaving
the field in each direction. For the creep/saltation size, the material
will most likely be deposited on the field boundary such as a stream,
fence, ditch, or road. If deposited in a ditch, subsequent rainfall
way wash the material in to waterways where it can affect water quality.
If deposited on a roadway, the roadway will likely need to be cleared.
For suspension and PM10 sizes, the material may travel great distances
affecting air quality. The material passing each boundary may indicate
that barriers may be needed on the opposite or upwind side of the field
to control wind erosion. The direction of soil loss may also indicate
a needed change in direction of tillage.
contain the mass per unit length of various sized material which
passed the field boundary for each direction (kg/m or tons/1000 ft).
This information is useful in determining how much material is leaving
the field in each direction. For the creep/saltation size, the material
will most likely be deposited on the field boundary such as a stream,
fence, ditch, or road. If deposited in a ditch, subsequent rainfall
way wash the material in to waterways where it can affect water quality.
If deposited on a roadway, the roadway will likely need to be cleared.
For suspension and PM10 sizes, the material may travel great distances
affecting air quality. The material passing each boundary may indicate
that barriers may be needed on the opposite or upwind side of the field
to control wind erosion. The direction of soil loss may also indicate
a needed change in direction of tillage.
Within Field Erosion Activity
The information in these columns is useful in determining how much of
the field is actively eroding and how much is not, which may impact
what control measures, if any should be applied and where. This
information is also useful in understanding how much of the field is
actively eroding and thus may be causing plant or soil damage or how
much is subject to burial. Finally, this information is useful in
understanding how much of the field is contributing to overall (net)
field loss.
Weather
The Weather columns provide a summary of some of the weather information
for the simulation run and help the user understand which periods are
erosive and why.
Average Total Precip.
This column contains the total precipitation for the period averaged
over the simulation years in each year of the crop rotation (mm or
inches). This section is useful in determining how precipitation
amounts may be affecting biomass production and roughness decay.
Average Wind Energy > 8m/s
This column contains the average daily wind energy for the period for
winds greater than 8 m/s, averaged over the simulation years in each
year of the crop rotation (KJ/day). This will indicate which periods
have the most erosive winds.
Average Snow Cover
If the field is covered with snow, it will be non-erodible.
Average Biomass Surface Conditions on Date
The Average Surface Biomass Conditions on Date columns provide a summary
of average surface conditions including crop biomass and soil roughness
for the simulation run.
Crop Vegetation (Live)
These columns provide information on the structural configuration of
live growing biomass. By observing the canopy cover, the standing
silhouette area index, and the above ground mass, the user can determine
which periods are not providing sufficient cover to control wind erosion.
Crop Residue (Dead)
These columns provide information on the structural configuration of dead
biomass or residue. By observing the flat cover, the standing silhouette
area index, the flat mass, and the standing mass, the user can determine
which periods are not providing sufficient residue cover to control wind
erosion.
Live and Dead Biomass
These columns provide information on the structural configuration of both
the live growing biomass and the dead biomass or residue. By observing
the flat cover, the standing silhouette area index, the flat mass, and the
standing mass, the user can determine which periods are not providing
sufficient cover to control wind erosion.
Average Soil Surface Conditions on Date
Roughness
For cropping systems that do not produce sufficient residue for erosion
control (e.g., cotton), roughness management is often used to reduce wind
friction velocity at the soil surface. This reduces the amount of soil
detachment and transport and increases deposition and thus soil loss.
Oriented Roughness
These columns refer to regularly spaced roughness elements caused by
tillage implements such as ridges, furrows and dikes. Ridge orientation,
width, and height may be adjusted for periods of high soil loss to
determine its effect on wind erosion. The user can also follow the
roughness decay over time as result of rainfall.
Random Roughness
This column contains the standard deviation of the soil surface random
roughness. This is the value at the period end, averaged over the
simulation years in each rotation year (inches or mm). Random roughness
is primarily the result of aggregate size distribution but is also
affected by various types of tillage tools. Random roughness values for
typical management operations are listed in Table 1. Photographs
(Figs. 1 - 9) can be used as a guide to determine relative random
roughness values.
Aggregation
Soil aggregate size and aggregate dry stability affect erosion by wind.
Soil aggregates greater than 0.84 mm in diameter are generally considered
to be non-erodible. Dry stability is related to abrasion resistance where
harder, more stable aggregates result in a lower erodibility of the soil.
Crust Cover
A soil crust will resist abrasion and erosion more than a loose finely
divides soil surface. Generally, the more of the surface is covered by
a crust, the lower the erosion that occurs. Crust are transient and
generally represent a degraded soil quality and therefore should not be
relied upon to control erosion by wind. However a high crust cover may
explain a lower erosion amount that would normally be expected.
Table 1. Random roughness values for typical
management operations based on a silt loam soil (Ag. Handbook 537).
Field Operation |
Random Roughness (inches) |
Field Operation |
Random Roughness (inches) |
Chisel, sweeps |
1.2 |
Fertilizer applicator, anhydrous knife |
0.6 |
| Chisel, straight point |
1.5 |
Harrow, spike |
0.4 |
| Chisel, twisted shovels |
1.9 |
Harrow, tine |
0.4 |
| Cultivator, field |
0.7 |
Lister |
0.8 |
| Cultivator, row |
0.7 |
Manure injector |
1.5 |
| Cultivator, ridge till |
0.7 |
Moldboard plow |
1.9 |
| Disk, 1-way |
1.2 |
Mulch treader |
0.4 |
| Disk, heavy plowing |
1.9 |
Planter, no-till |
0.4 |
| Disk, Tandem |
0.8 |
Planter, row |
0.4 |
| Drill, double disk |
0.4 |
Rodweeder |
0.4 |
| Drill, deep furrow |
0.5 |
Rotary hoe |
0.4 |
| Drill, no-till |
0.4 |
Vee ripper |
1.2 |
| Drill, no-till into sod |
0.3 |
|
|
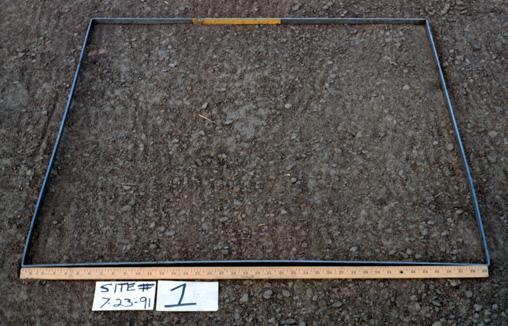
Figure 1. Random roughness of 0.25 inches(6 mm).
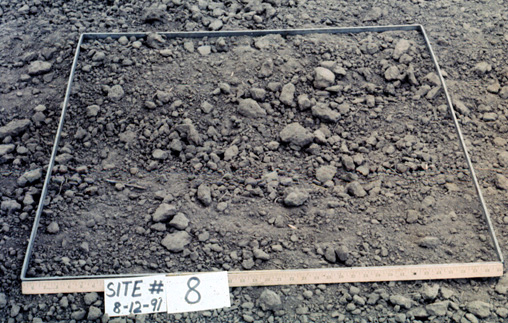
Figure 2. Random roughness of 0.40 inches (10 mm).
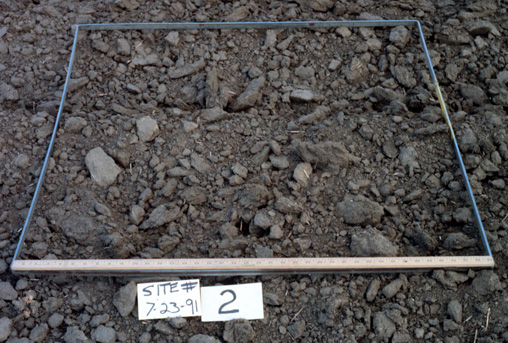
Figure 3. Random roughness of 0.65 inches (17 mm).
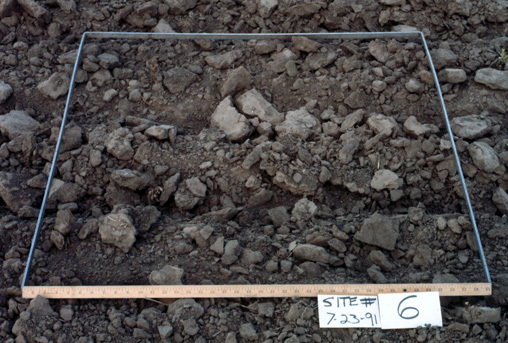
Figure 4. Random rughness of 0.75 inches (19 mm).
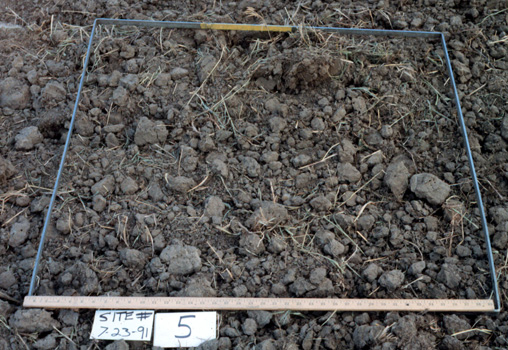
Figure 5. Random roughness of 0.85 inches (22 mm).
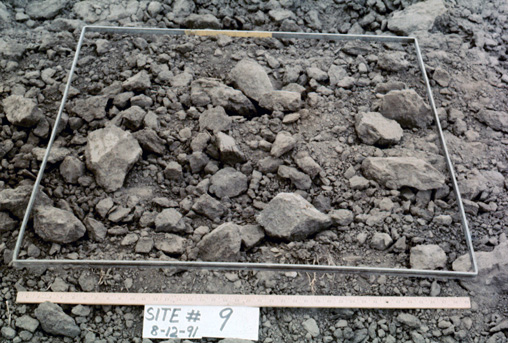
Figure 6. Random roughness of 1.05 inches (27 mm).
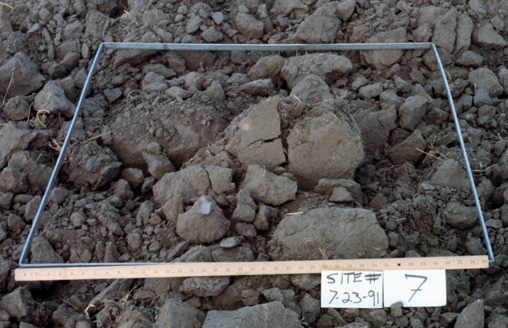
Figure 7. Random roughness of 1.60 inches (41 mm).
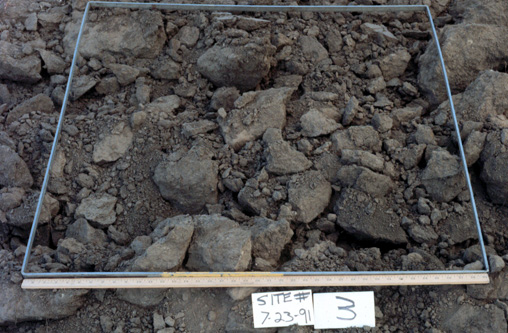
Figure 8. Random roughness of 1.70 inches (43 mm).
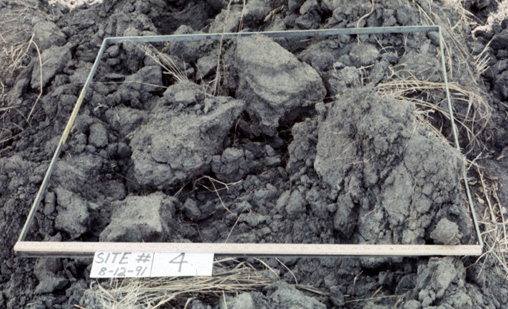
Figure 9. Random roughness of 2.15 inches (55 mm).