 |
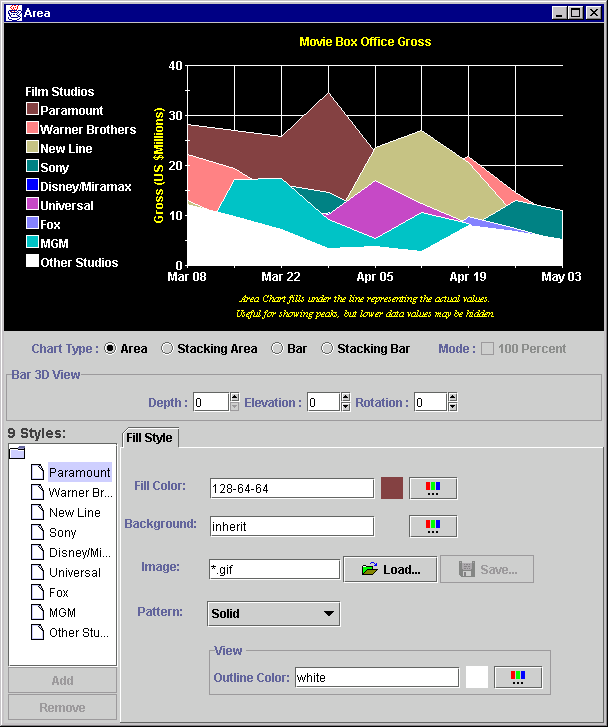
Area Chart Demo
Showcases the various types of Area charts: Area, Stacking Area, and Stacking Area as Percentage. |
 |
Stacking Bar Demo
Shows basic stacking bar chart functionality, including interactive rotation. |
 |
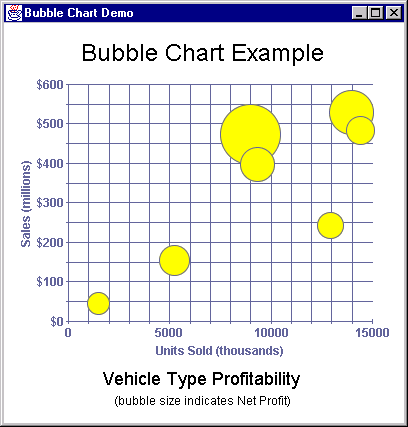
Bubble Chart Demo
Shows how to use custom shapes to mimic the functionality of a Bubble Chart. |
 |
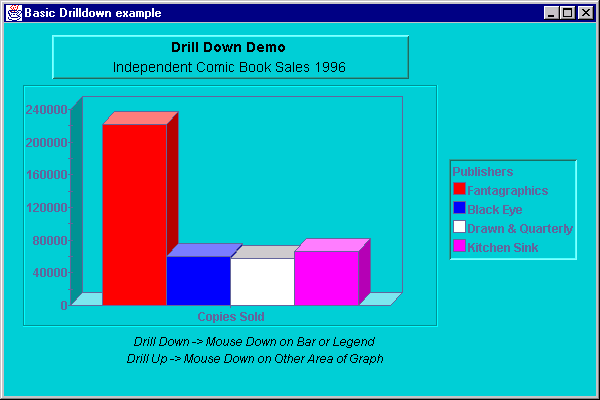
Drill Down Demo
Shows how to represent hierarchical data sets and navigate them graphically. |
 |
Fast Update Demo
Demonstrates Chart's dynamic updating features using a threaded data source. |
 |
Financial Demo
Shows financial data plotted using multiple data views and different chart types on a single chart. |
 |
Chart Label Demo
Shows how to use chart labels and dwell labels to make charts come alive. |
 |
Multiple Chart Demo
Shows how to use multiple charts in a single application. |
 |
Pie Chart Demo
Demonstrates basic pie charts, including interactive depth and tilting. |
 |
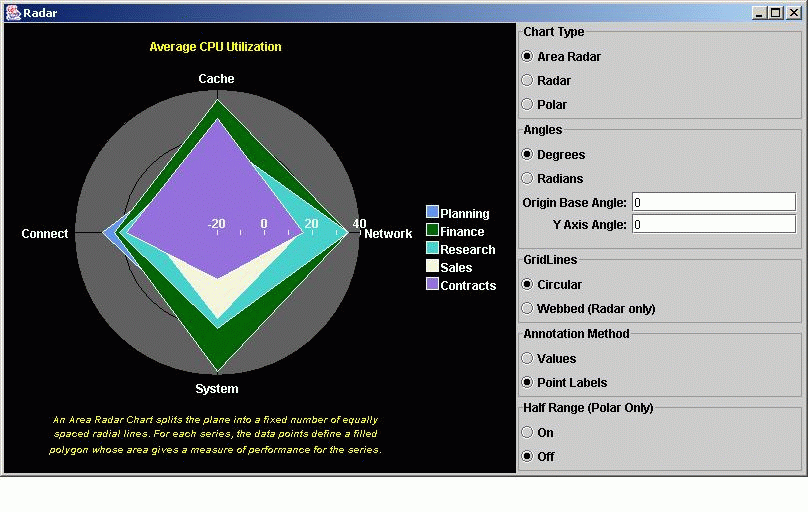
Radar Chart Demo
Demonstrates basic radar, area radar, and polar charts. |
 |
Scroll Time Demo
Shows how to draw directly on the chart to create a unique selection effect. Scroll bar controls x axis range. Has three y axes! |
 |
Candle/HiLo Chart Demo
Shows Chart's financial chart types. |
 |
Strip Chart Demo
Shows Chart using an updating data source (producer/ consumer model). A great threading example! |
 |
Supportometer Demo
Shows how to use multiple data views to cluster Stacking Bar charts. |