  
|
2
Programming JClass Chart 3D: Common Functions
Properties
Axis Controls
Axis Scaling
Adding Header, Footer, and Labels
All elements mentioned in this chapter refer to both the Java 2 API
and the Java 3D API unless specifically noted.
2.1 Properties
"Properties" are the named method attributes of a class that can affect its appearance or behavior. Properties that are readable have a "get" (or "is" for Booleans) method, which enables the developer to read a property's value, and those properties that are writable have a "set" method, which enables a property's value to be changed.
For example, the JClass Chart 3D
JCAxisclass has a property calledannotationMethod, which is used to indicate the style of annotation used on the axis. To set the property value, thesetAnnotationMethod()method is used. To get the property value, thegetAnnotationMethod()method is used.It is not necessary to remember all the properties in order to program JClass Chart 3D effectively. For most charts, many properties may be left with their default settings. A full summary of the JClass Chart 3D properties for all commonly used classes is provided in Appendix B. Scan through those tables to gather a basic understanding of the properties. Not all the properties are used for all types of charts: some are specific for Surface and Bar charts only, while others are for Scatter Plots only.
For complete details on how JClass Chart 3D's object properties are organized, see JClass Chart 3D Object Containment and Setting and Getting Object Properties, in Chapter 1.
2.1.1 Setting JavaBean Properties at Design-Time
JClass Chart 3D has two JavaBeans: chart3dJava2d for Java 2 and chart3dJava3d for the Java 3D API.
One of the features of any JavaBean component is that it can be manipulated interactively in a visual design tool (such as a Java IDE) to set the initial property values when the application starts. Consult your IDE's documentation for details on how to load third-party JavaBean components into the IDE.
For details on JClass Chart 3D's JavaBeans and IDEs, please refer to the JClass and Your IDE chapter in the JClass DesktopViews Installation Guide. The JClass DesktopViews Installation Guide is available in HTML and PDF formats, and is included when you purchase JClass Chart 3D. The readme file contains the most current list of supported IDEs.
Most IDEs list a component's properties in a property sheet or dialog. Simply find the property you want to set in this list and edit its value. Again, consult the IDE's documentation for complete details.
2.1.2 Setting Properties Interactively at Run-Time
If enabled by the developer, end-users can manipulate property values on a chart running in your application. Clicking a mouse button launches the JClass Chart 3D Customizer. The user can navigate through the tabbed dialogs and edit the properties displayed.
For details on enabling and using the Customizer, please see The JClass Chart 3D Customizer, in Chapter 1, as well as Programming User Interaction, in Chapter 7.
2.2 Axis Controls
2.2.1 Axis Show
The
showproperty ofJCAxistells JClass Chart 3D whether it should draw the axis at all. If set tofalse, the axis will not be drawn.
2.2.2 Axis Font and Size
The axis annotation is rendered using the font specified by the
annoFontproperty ofJCAxis. The font is scaled to be the size specified by theannoFontCubeSizeproperty.The
annoFontCubeSizeis measured in units, which are each 1/1,000 of the plot cube length. The defaultannoFontCubeSizeis 80, which means the characters are 8% of the length of the plot cube high. Thus, if the plot cube changes size, so does the annotation.
2.2.3 Title
The
JCAxistitleproperty may be used to specify a title for each axis. Titles are rendered usingtitleFontand in a size specified bytitleFontCubeSize.
2.3 Setting Axis Bounds
Normally a graph displays all of the data it contains. There are situations where only part of the data is to be displayed. This can be accomplished by fixing axis bounds.
2.3.1 Min and Max
Use the
minandmaxproperties ofJCAxisto frame a chart at specific axis values. TheminIsDefaultandmaxIsDefaultproperties allow the chart to determine axis bounds automatically, based on the data bounds.If the
minIsDefaultproperty of aJCAxisobject istrue, every time the JClass Chart 3D data is changed, JClass Chart 3D will determine a reasonable default value for the axis minimum. Iffalse, JClass Chart 3D will use the provided axis minimum.Please note that there is a restriction on the
minandmaxproperties of the Z-axis; these are not allowed inside the Z-range of the data.A side effect of setting any property that has a corresponding
UseDefaultproperty is that theUseDefaultproperty will be set to false.The following code will freeze the value of
JCAxis yAxis = c.getChart3dArea().getYAxis();minIsDefaultat its current value. It will also have the side effect of settingminIsDefaultto false.
yAxis.setMin(yAxis.getMin());The following code will revert back to the default behavior, enabling JClass Chart 3D to calculate a default value for
yAxis.setMinIsDefault(true);minIsDefaultwhenever it draws the graph.
2.4 Legends
A legend itemizes the visual attributes used to identify data in the chart. You can customize the labels in the legend and the position of the legend. The legend is a
JComponent, and all properties apply.The
JCChart3dLegend legend = (JCChart3dLegend) chart3d.getLegend();getLegend()method ofJCChart3dreturns an instance of the abstract classJCLegendso that any subclass may be used as a legend. To utilize some of the 3D-specific properties described below, such aslayoutStyleanddistributionRange, you will need to cast the class toJCChart3dLegend. For example:
2.4.1 Legend Display
JClass Chart 3D will generate a legend only when the legend's
Visibleproperty is set totrue. By default, there is no legend displayed.If contours are drawn and zones are not, a legend listing the contour lines is generated. If zones are drawn, the legend lists the fill colors for each level. If points are drawn, the legend lists the symbols used for each series of points.
By default, JClass Chart 3D will attempt to list the legend contents vertically and position the legend to the right (that is, east) of the graph area.
2.4.2 Legend Text, Orientation, and Positioning
Legend Text
How the legend displays the text depends on the type of chart and data being plotted. In most cases, the text is based on contour levels.
If a scatter chart is plotting point data, the text is based on the
labelproperty of each series in the data view. If a scatter chart is plotting grid data with both zones and contours turned off, the text is based on thenameproperty of the grid data object.Legend Orientation
Use the legend
Orientationproperty to lay out the legend horizontally or vertically.Legend Positioning
The
JCChart3dLegendclass positions items in a grid wherein every row has the same height and every column the same width.JCChart3dLegendis a subclass of the abstract classJCLegend, and all ofJCLegend's properties are inherited byJCChart3dLegend.Use the legend
Anchorproperty to specify where to position the legend relative to thechart3dArea. You can select from eight compass points around thechart3dArea.
Figure 6 : Vertically oriented legend anchored NorthEast.
2.4.3 Scatter Plot Charts
Scatter Plots of Point Data
For scatter plots of point data, the legend labels are derived from each
Chart3dPointSerieslabelproperty (found in theChart3dPointDataobject). Each label's corresponding symbol is determined from theSymbolStylelocated in the series'ChartStyleproperty.Scatter Plots of Grid Data
For scatter plots of grid data, the legend style depends on whether the contouring information has been computed (that is, if either of the
contouredandzonedproperties of thedataView's contour object aretrue, the contours are computed). If contouring information has been computed, the legend entries are the same as they would be for surface plots and bar charts (see Section 2.4.4, Surface and Bar Charts). For each contour level there is also a symbol that is plotted (retrieved from theSymbolStyleproperty of the contour style for this level).If the contours are not computed, the
LineStyleandSymbolStylefrom theChart3dGridDataobject'sChartStyleproperty are used to draw a single legend entry. The label for this entry is derived from theNameproperty of theChart3dGridDataobject.
2.4.4 Surface and Bar Charts
For surface and bar charts, the legend labels are determined by the value of the contours being used by the chart, while the color swatch is determined by each contour's
contourStyleobject. There are also variations, depending on selected properties (detailed below) of the chart and legend.When applicable, the
LayoutStyleproperty of the legend determines the type of layout that the legend will use. Please see later in this section for more information.Possible values for the
LayoutStyleproperty areCONTINUOUSandSTEPPED.CONTINUOUSis the default and displays the contour style fill colors as a continuous range, with contour level values placed at the transition points.STEPPEDbreaks down this continuous range into a series of smaller ranges defined by each contour level color.
Figure 7 : Continuous (left) and Stepped (right) Legends.
For example, an item in a
STEPPEDlegend will show a box of color followed by a String of the form "min .. max". Theminandmaxvalues are determined by the values of the contour levels that bound this range. The color is determined by the fill color of the contour style of the top contour level in the range. In most cases, the existing contour ranges will be extended to theminandmaxof the data.This
LayoutStyleproperty is ignored when other properties interfere with the way things can be laid out. For example, if zones are not being drawn (isZoned()=falseon theJCContourorJCProjectionobjects), the legend will be drawn as a series of items, each representing one contour line. The color of the line in the legend is derived from theLineStyleof theJCContourStyleof the contour being referenced.If shading is not being done (
isShaded()=falseon theJCElevationobject), then the items in the legend will appear as a series of lines, each representing a different contour zone. The color is determined from theFillStyleof theJCContourStyleof the contour zone.The
DistributionRangeproperty determines the range of contour levels to be displayed in the legend. If using the default contours, theDistributionRangeproperty has no effect. If the user has specified contour levels, a value ofRANGE_DATA(the default) will restrict the contour levels in the legend to those in the range specified by the dataminandmax. A value ofRANGE_ALLwill cause all user-set contour levels to display.There is also a modest number of small properties of
JCChart3dLegendthat the user can set to change the layout of legend items:
MarginGap- the distance between the edge of the legend and the first legend item.GroupGap- the distance between groups of legend items; for instance, columns.HorizontalItemGap- the distance between legend items in a horizontal legend.VerticalItemGap- the distance between legend items in a vertical legend.InsideItemGap- the distance between the symbol and text portion of the legend item.
2.4.5 Overriding Labels
There are two ways a user may override the default labels generated for the legend:
In the first method, the
Labelsproperty takes aListobject that contains aListobject for each data view. (Currently, JClass Chart 3D supports only one data view.) Each internalListcontains a series ofStringorJCMultiFieldStringobjects that are to be used to override the default legend labels.The labels are to be placed in sequence, from bottom to top legend item. For example, the first label in the
Listwill be used to represent the bottom item in the legend. If the user does not give enough labels to cover those needed,JCChart3dLegendwill use default labels for the remainder of the unspecified labels.In the second method, the
Object generateLegendLabel(JCChart3d chart3d, int level, double zmin, double zmax, Object label)LabelGeneratorproperty takes any class that has implemented theJCChart3dLegendLabelGeneratorinterface. This interface has one method:where
chart3dis theJCChart3dinstance to which this legend is attached,levelis the contour level this label represents,zminis the minimum value of the contour level range,zmaxis the maximum value of the contour level range, andlabelis the value of the legend item's label so far (that is, either the default generated label or the label specified by the user with theLabelsproperty). Please note that in some cases,zminandzmaxwill be equal.Any
StringorJCMultiFieldStringreturned by the implementor of this method will be used to label the legend item for the specified contour level. If null is returned, no legend item will be created for the specified contour level.
2.4.6 JCMultiFieldString
The
JCMultiFieldStringclass handles multifield Strings, where each field may have a different alignment of text within its field. This class is used by theJCChart3dLegendclass to manage specialized legend text.new JCMultiFieldString("\\rRight Text\\cCenter Text\\lLeft Text");
JCMultiFieldStringencapsulates a String that has multiple String fields, each with a potentially different alignment. Here is an example of how it is created:where
\rrepresents right alignment of the field,\crepresents center alignment of the field, and\lrepresents left alignment of the field. Each alignment character marks the beginning of a new field.The
JCMultiFieldStringclass converts this encoded String into an internal representation that can be drawn byJCChart3dLegendsuch that all fields are aligned as indicated. Any number of fields may be present.This object may be included in either the
Labelsproperty or theObjectthat is returned by the method implementing theJCChart3dLegendLabelGeneratorinterface.
2.4.7 JCLegend Toolkit
The JCLegend Toolkit allows you the freedom to design your own legend implementations. The options range from simple changes, such as affecting the order of the items in the legend, to providing more complex layouts.
The JCLegend Toolkit consists of a
JCLegendclass that can be subclassed to provide legend layout rules and two interfaces:JCLegendPopulatorandJCLegendRenderer.JCLegendPopulatoris implemented by classes wishing to populate a legend with data, andJCLegendRendereris implemented by a class that wishes to help render the legend's elements according to the user's instructions.
JCChart3dLegendManageris the class used by JClass Chart 3D to implement both theJCLegendPopulatorandJCLegendRendererinterfaces, and to provide a built-in mechanism for itemizing range objects in a legend.Custom Legends - Layout
To provide a custom layout, override the method:
public abstract Dimension layoutLegend(List itemList, boolean, vertical, Font useFont)The
itemlistargument is aListcontaining aVectorfor each data view contained in the chart. Each of these sub-vectors contains oneJCLegendIteminstance for each series in the data view and one instance for the data view title.The
verticalargument istrueif the orientation of the legend is vertical, andfalseif the orientation of the legend is horizontal.The
useFontargument contains the default font to use for the legend.Each item in the legend consists of a text portion and a symbol portion. For example, in a
JCChart3dSTEPPEDlegend, the text portion is the range between two contour levels, while the symbol portion is the box of color used to represent such values on the chart. For the title of the data view, the text portion is the name of the data view, and there is no symbol.
JCLegendItemis a class that encapsulates an item in the legend with the properties.When the
itemListis passed tolayoutLegend, it has been filled in withJCLegendIteminstances representing each data series and data view title. These instances will have thesymbolDim,textDim,symbol,contents,itemInfo, anddrawTypealready filled in.The value of
drawTypewill determine whether a particular default symbol type will be drawn, or whether user-provided drawing methods will be called.The
layoutLegend()method is expected to calculate and fill in thepos,symbolPos,textPos, anddimfields. Additionally, the method must return aDimensionobject containing the overall size of the legend. Optionally, it may also calculate thepickRectanglemember of theJCLegendItemclass. ThepickRectangleis used in pick operations to specify the region in the legend that is associated with the data that this legend item represents. If left null, a defaultpickRectanglewill be calculated using thedimandposmembers.Any of the public methods in the
public int getSymbolSize()JCLegendclass may be overridden by a user requiring custom behavior. One such method is:
getSymbolSize()returns the size of the legend-calculated symbols to be drawn in the legend. DefaultJCLegendbehavior sets the symbol size to be equal to the ascent of the default font that is used to draw the legend text. It is overridable by users who wish to use a different symbol size. One possible implementation is to use a symbol size identical to that which appears on the actual chart.The easiest way to change default legend behavior without implementing all of the above is to subclass the existing
JCChart3dLegendclass. It implements all the above methods to lay out legend items in a straightforward grid.Custom Legends - Population
public List getLegendItems(FontMetrics fm)
JCLegendPopulatoris an interface that can be implemented by any user desiring to populate the legend with custom items. This interface comprises two methods that need to be implemented:
public boolean isTitleItem(JCLegendItem item)
getLegendItems()should return aListobject containing any number ofVectorobjects where eachVectorobject represents one column in the legend. EachVectorobject contains theJCLegendItemobjects for that column. In JClass Chart 3D, each column generally represents one data view.
isTitleItem()should returntrueorfalsedepending on whether the passedJCLegendItemobject represents a title for the column. This is used to determine whether a symbol is drawn for a particular legend item.If implemented, the legend should be notified of the new populator with the
setLegendPopulator()method ofJCLegend.Custom Legends - Rendering
public void drawLegendItem(Graphics gc, Font useFont, JCLegendItem thisItem)
JCLegendRendereris an interface that can be implemented by any user desiring to custom render legend items. This interface consists of five methods that need to be implemented:
public void drawLegendItemSymbol(Graphics gc, Font useFont, JCLegendItem thisItem)
public Color getOutlineColor(JCLegendItem thisItem)
public void setFillGraphics(Graphics gc, JCLegendItem thisItem)
public void drawLegendItemText (Graphics gc, Font useFont, JCLegendItem this Item);
drawLegendItem()provides a way for a user to define a custom drawing routine for an entire legend item. It is called when a legend item's draw type has been set toJCLegend.CUSTOM_ALL.
drawLegendItemSymbol()provides a way for a user to define a custom drawing routine for a legend item's symbol. It is called when a legend item's draw type has been set toJCLegend.CUSTOM_SYMBOL.
getOutlineColor()should return the outline color to be used to draw the legend item's symbol. If null is returned, the legend's foreground color will be used.getOutlineColor()is called when a legend item's draw type has been set to eitherJCLegend.BOXorJCLegend.IMAGE_OUTLINED.
setFillGraphics()should set the appropriate fill properties on the providedGraphicsobject for drawing the provided legend item.setFillGraphics()is called when the legend item's draw type has been set toJCLegend.BOX,JCLegend.BOX_PLAIN, orJCLegend.LINE.
drawLegendItemText()provides a way for the user to define drawing for custom text objects. When the legend does not recognize the object in the contents field of aJCLegendItem(that is, it is not a String), this method will be called.If implemented, the legend should be notified of the new renderer with the
setLegendRenderer()method ofJCChart3dLegend.
2.5 Perspective
The
JCView3dclass'Perspectiveproperty controls the perspective effect observed by projecting the plot cube onto the screen (the default value is 2.5). Small values exaggerate the perspective effect, while large values diminish it. Valid values are between 1 andJCView3d.MAX_PERSPECTIVEwhich is 500.
Figure 8 : Perspective Depth Measurement.
2.6 Axis Scaling
The
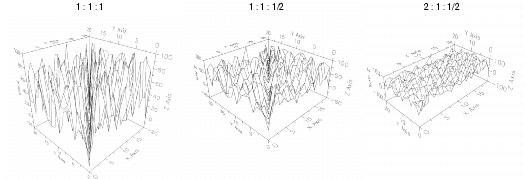
JCPlotCubeclass can be used to adjust the X, Y and Z dimensions of the unit cube relative to one another for Surface, Bar, or Scatter Plot charts. For example, if you would like the 3D display to be twice as long in the Y direction as in the X, set the Y scale to twice the X-scale. The default value of eachScaleproperty is 1.0.Here is a code snippet showing how to produce the right most chart of Figure 9:
JCPlotCube plotcube=c.getChart3dArea().getPlotCube();
plotcube.setXScale(2.0);
plotcube.setZScale(0.5);Setting the Z scale higher or lower has the effect of flattening or stretching the surface view.
Figure 9 : Axis scaling using various X: Y: Z ratios.
.
2.7 Axis Labelling and Annotation Methods
There are several ways to annotate the chart's axes, each suited to specific situations. The chart can automatically generate numeric annotation appropriate to the data it is displaying; you can provide a label for each grid point in the chart (X- and Y-axis for grid data only); you can provide a label for specific values along the axis.
Whichever annotation method you choose, the chart makes considerable effort to produce the most natural annotation possible, even as the data changes. You can fine-tune this process using axis annotation properties.
2.7.1 Choosing Annotation Method
A variety of properties combine to determine the annotation that appears on the axes. The
JCAxisAnnotationMethodproperty specifies the method used to annotate the axis. The valid annotation methods are:The following topics discuss setting up and fine-tuning each type of annotation.
2.7.2 Values Method
When the
annotationMethodproperty is set toANNOTATION_VALUES, JClass Chart 3D will automatically annotate the axis based on the range of data. This is the default annotation method. It is most suitable for the Z-axis, and for the X- and Y-axes when the chart type is surface.
2.7.3 Data Labels Method
If grid data is being plotted, individual lines in a surface, or a row/column of bars, can be labelled using the
ANNOTATION_DATA_LABELSmethod.This annotation method uses an array of Strings supplied as
xLabelsoryLabelsthrough theLabelledChart3dGridDataModelinterface to annotate each line from the grid. If a String in the list is null, a label is not drawn for that grid value, but the corresponding tick is drawn. ThexLabelsandyLabelsarray can also be set directly through methods provided in theChart3dGridDataclass. Labels can be set as a list of Strings or as anArrayListof objects of typeString,JCValueLabel, or any other object whosetoString()value is meant to be used as the label.Data Label Clustering
Consecutive data labels can be combined into one label (in other words, when data labels are aggregated into a label cluster where only one label is displayed). In order for this to happen, ensure that:
- the annotation method is set to
JCAxis.ANNOTATION_DATA_LABELS- the
combineLabelsproperty of the correspondingJCAxisobject is set totrue- the list of data labels contains one or more sub-lists of identical labels.
If data labels are specified via a list of
Stringobjects, andmconsecutive labels are identical (they must point to the exact sameString), they form a cluster ofmlabels, from which one is used to draw the label. Ifmis odd, the middle label of the cluster is used as the label. Ifmis even, a new label is positioned at the average value of the labels. The tick marks and gridlines in the cluster range are still drawn as if there was no clustering.If data labels are specified via a list of
JCValueLabelobjects, thelabelproperty of thevalueLabelsin the same cluster must point to the sameStringobject. In the same way that data labels are handled with a list ofStringobjects, if consecutivevalueLabelsdo not contain to the samelabelobject, they will not belong to the same cluster (even if theequalsmethod would returntrue). This allows the user to have two consecutive identical Strings without forcing them to be in the same cluster.
2.7.4 ValueLabels Annotation
ValueLabelsannotation displays labels at the axis coordinate specified. This is useful for displaying special text at a specific axis coordinate, or when a type of annotation that the chart does not support is needed, such as scientific notation. You can set the axis coordinate and the text to display for eachValueLabel, and also add and remove individualValueLabels.
Figure 10 : Using ValueLabels to annotate axes.
Every label displayed on the axis is one
ValueLabel. EachValueLabelhas aValueproperty and aLabelproperty. Additionally, thetickDrawn,labelDrawn, andminorTickproperties control the display of the label and tick of the value label. The background and foreground of each label can also be set. These are null by default (in other words, no background is drawn, and the foreground color of the plot cube is used).Please note that background colors for labels is currently not available in the Java 3D API version of JClass Chart 3D.
If the
JCAxis x=c.getChart3dArea().getXAxis();AnnotationMethodproperty is set toJCAxis.ANNOTATION_VALUE_LABELS, the chart places labels at explicit locations along an axis. TheValueLabelsproperty ofJCAxis, which is a collection ofValueLabels, supplies this list of Strings and their locations. For example, the following code sets value labels at the locations 10, 20 and 30:
x.setValueLabels(0, new JCValueLabel(10, "Label"));
x.setValueLabels(1, new JCValueLabel(20, "Label 2"));
x.setValueLabels(2, new JCValueLabel(30, "Label 3"));The
JCValueLabel v1ValueLabelscollection can be indexed either by subscript or by value:
// this retrieves the label for the second Value-label
v1=c.getChart3dArea().getXAxis().
getValueLabels(1);
// this retrieves the label at chart coordinate 2.0
v1=c.getChart3dArea().getXAxis().
getValueLabels(2.0);
2.7.5 Custom Axes Labels
JClass Chart 3D will label axes by default. However, you can also generate custom labels for the axes by implementing the
JCLabelGeneratorinterface. This interface has one method -makeLabel()- that is called when a label is required at a particular value.To generate custom axes labels, the axis'
AnnotationMethodproperty, which determines how the axis is labelled, must be set toANNOTATION_VALUES. Also, the axis'setLabelGenerator()method must be called with the class that implements theJCLabelGeneratorinterface.The
makeLabel()method is called for each label and tick that gets generated along the axis.The
makeLabel()method takes one parameter:vLabel(the internal value label that will be used to annotate the value). The user can then modify thelabeland the other properties of the value label.
- The
tickDrawnproperty controls whether a tick mark is drawn for this value label.- The
labelDrawnproperty controls whether a label is drawn for this value label.- The
minorTickproperty determines whether a major or minor tick is drawn for this value label. If set totrue, a minor tick is drawn. If set tofalse(the default value), a major tick is drawn instead. Please note that nothing is drawn if thetickDrawnproperty has been set tofalse.- The foreground and background colors can be set for this value label.
Here is a code example showing how to customize the labels for a linear axis by implementing the
class MyLabelGenerator implements JCLabelGeneratorJCLabelGeneratorinterface. In this case, Roman numeral labels are going to be generated (instead of the usual Arabic labels) for the numbers 1 through 10.
{
public void makeLabel(JCValueLabel vLabel) {
int intvalue = (int) vLabel.getValue();
String s = null;
switch (intvalue) {
case 1 :
s = "I";
break;
case 2 :
s = "II";
break;
case 3 :
s = "III";
break;
case 4 :
s = "IV";
break;
case 5 :
s = "V";
break;
case 6 :
s = "VI";
break;
case 7 :
s = "VII";
break;
case 8 :
s = "VIII";
break;
case 9 :
s = "IX";
break;
case 10 :
s = "X";
break;
default :
s = "";
vLabel.setTickOnly(true);
return;
}
vLabel.setLabel(s);
vLabel.setTickOnly(false);
}
}Note that you will need to specify the label generator as follows:
axis.setLabelGenerator(new MyLabelGenerator());Also note that JClass Chart 3D calls the
makeLabel()method for each needed label and tick. Thus, if JClass Chart 3D needs n labels and ticks, themakeLabel()method is called n times.
2.7.6 Rotating Axis Labels
The
annotationRotationproperty allows you to specify the rotation of a chart's axis labels. The default value isANNOTATION_ROTATION_DEFAULT. When explicitly setting the annotation rotation for an axis, please note that the number of labels may not change from the default case, even if more will fit on the axis.Note: If the axis annotation rotation is explicitly set to horizontal or vertical, there may be overlapping labels.
2.7.7 Label Selection and Clustering
Users can select labels through the normal "pick" mechanism of JClass Chart 3D. If the user instantiates a pick listener (this is part of the standard user actions; please see Mapping and Picking, in Chapter 7), the chart will return a
JCData3dLabelIndexobject if a label has been selected. TheJCData3dLabelIndexhaslabelIndexandvalueLabelproperties which respectively store the selected label's index and the internal value label corresponding to the selected label. Note that in the event of label clustering thelabelIndexwill be the index of the first label in the cluster.Please note that this is currently not available in the Java 3D API version of JClass Chart 3D.
2.8 Gridlines
Gridlines can be displayed on each of the three primary planes - the XY plane, the XZ plane, and the YZ plane - using the properties of the
JCGridLinesclass. This class specifies which gridlines are drawn for a given axis, via a plane mask. Planes are selected by "or"ing in the appropriate plane constants.These constants of the
JCGridLinesclass specify the possible planes:For instance, the X-axis controls gridlines that are perpendicular to the X-axis in the XY and the XZ plane.
To draw X-gridlines in all applicable planes, set
JCGridLinesto the value(XY_PLANE | XZ_PLANE). To remove gridlines completely, set the value to 0.As another example, here is a code sample showing how to set a plane mask:
JCGridLines gl=c.getChart3dArea().getZAxis().getGridLines();
gl.setPlaneMask(XZ_PLANE|YZ_PLANE);Gridlines are drawn where annotation is drawn on the axis, regardless of the annotation method.
2.8.1 Gridline Styles
The gridline's style - color, pattern, and width - are controlled by the
JCLineStyleclass. AJCGridLinesobject initializes itslineStyleso that by default, a solid black line of width 1 is drawn. The properties of the initial defaultlineStylecan be changed or a newlineStylecan be set on theJCGridLinesobject.Here's an example showing the code to set the Y-axis gridlines to blue, have a dash_dot pattern, and be 4 pixels in width:
JCGridLines g1=c.getChart3dArea().getYAxis().getGridLines();
g1.setLineStyle(new JCLineStyle(4,Color.blue,JCLineStyle.DASH_DOT));Color
To set the color of the gridlines, choose the AWT color class representing the color to be used to draw the lines. If null, the current color of the
Graphicsobject is used. The following table summarizes the built-in color names defined injava.awt.Color:Alternately, you can specify a color by its RGB components, useful for matching another RGB color. RGB color specifications are composed of a value from 0 - 255 for each of the red, green and blue components of a color. For example, the RGB specification of Cyan is "0-255-255" (combining the maximum value for both green and blue with no red).
Take care not to choose a gridline color that is also used to display data in the chart. The default
JCLineStyleuse all of the built-in colors in the following order: Red, Orange, Blue, Light Gray, Magenta, Yellow, Gray, Green, Dark Gray, Cyan, Black, Pink, and White. Note that JClass Chart 3D will skip colors that match background colors. For example, if the chart area background is Red, then the line, fill, and symbol colors will start at Orange.Pattern
To set the pattern, use the
Patternproperty, which dictates the pattern used to draw a line. Choices for gridline pattern are:You can also create a custom user-defined pattern for the gridlines. Here is a method declaration showing how to do this:
public void setPattern(float[] patternArray, float[]
legendPatternArray)where
patternArrayis an array of floats representing the pattern to use when drawing this line, andlegendPatternArrayis an array of floats representing the pattern to use when drawing this line in the legend. A note of caution: if the values get too small, nothing will be drawn.Width
The width of the gridlines can be set using the
setWidth()method. A positive integer is required.
2.9 Header and Footer Titles
JClass Chart 3D can have two titles, called the header and footer. By default they are
JLabelinstances and behave accordingly (aJLabelclass is a Swing class). AJLabelobject can display text, an image, or both.You can specify where in the label's display area the label's contents are aligned by setting the vertical and horizontal alignment. By default, labels are vertically centered in their display area. Text-only labels are left-aligned, by default. Image-only labels are horizontally centered by default.
A title consists of one or more lines of text with an optional border, both of which you can customize. You can also set the text alignment, positioning, colors, and font used for the header or footer.
See "How to Use Labels" in the Java Tutorial (http://java.sun.com/docs/books/tutorial/uiswing/components/label.html) for further information.
2.10 Adding Header, Footer, and Labels
JClass Chart 3D will always try to produce a reasonable chart display, even if very few properties have been specified. JClass Chart 3D will use intelligent defaults for all unspecified properties.
All properties for a particular chart may be specified when the chart is created. Properties may also be changed as the program runs by calling the property's
set()method. A programmer can also ask for the current value of any property by using the property'sget()method.Adding Headers and Footers
To display a header or footer, the properties of the Header and Footer objects contained in the chart need to be set. For example, the following code sets the
// Make footer visibleTextandVisibleproperties for the footer:
chart3d.getFooter().setVisible(true);
// By default, footer is a JLabel - set its Text property
((JLabel)chart3d.getFooter()).setText("1963 Quarterly Results");The
Visibleproperty controls whether the header or footer is displayed.Textspecifies the text displayed in the header or footer.
|
|