  
|
3
Programming JClass Chart 3D: Surfaces and Bars
Fifteen Basic Types of Surfaces and Bars
Chart Types
Contours and Zone Display
All elements mentioned in this chapter refer to both the Java 2 API
and the Java 3D API, unless specifically noted.
3.1 Fifteen Basic Types of Surfaces and Bars
One of the types of data that can be attached to JClass Chart 3D is grid data. Grid data that has been attached to the chart can be displayed in a surface, bar, or scatter plot representation. Grid data is supplied to the chart via
Chart3dDataView'selevationDataSourceproperty. The chart then processes the data and stores it in an internal data object of typeChart3dGridData. For elevation data, this internal object can be referenced via theelevationDataproperty. The user can retrieve this internal object, query it for data values, and set certain properties on it.The chart uses elevation data to draw a surface plot, bar plot, or scatter plot, depending on the
chartType, which will beSURFACE,BAR, orSCATTER.An
elevationDataSourcemust implement theChart3dDataModelinterface. To be grid data, it must also implement theChart3dGridDataModelinterface. This promises the chart that it can supply anxGridarray, ayGridarray, and a doubly indexedzValuesarray. If the datasource wants to provide X- and Y-data labels to the chart, it should implement theLabelledChart3dGridDataModelinterface. Similarly, a hole value, other than the default, can be provided through theHoleValueChart3dDataModel. Data values can be edited through theEditableChart3dDataModeland data changes can be monitored if the datasource implements theChart3dDataManagerinterface.The
elevationDataSourcecan also take points as its data type. This type of data can only be used for scatter plots.Note that using a data set of type
pointwith a chart type ofSURFACEorBARwill produce a blank plot.When grid data is used and the chart type is either
SURFACEorBAR, JClass Chart 3D's four basic display Boolean properties -Meshed,Shaded,Contoured, andZoned- combine to create 15 different basic surface and bar displays. No graph is displayed when all four Booleans arefalse.
3.1.1 JCElevation: Meshed, Shaded, and Transparent Plots
The
JCElevationobject determines whether surface and bar plots are Meshed, Shaded, or Transparent. TheJCElevationconstructor initializes theMeshed,Shaded, andTransparentproperties (each of which takes a Boolean value). The defaults for each of these areMeshed=true,Shaded=false, andTransparent=false.Meshed
Surfaces: When
Meshedistrue, JClass Chart 3D displays the X-Y grid projected onto the 3D surface in a 3D view with a Z-axis. You can use thexMeshShowandyMeshShowproperties ofJCSurfaceto individually control whether the X- and Y-mesh lines are showing.The
xMeshFilterandyMeshFilterproperties ofJCSurfaceallow every nth mesh line to be drawn. By default, the chart chooses a pleasing filtering. ThemeshTopColorandmeshBottomColorproperties allow the user to control the top and bottom colors of the mesh lines.Bars: When
Meshedistrue, JClass Chart 3D will draw the outline of all the bars. All bars with a value greater than or equal to the origin of the Z-axis will be outlined using themeshTopColor, and all bars with a value less than the origin will be outlined using themeshBottomColor. WhenTransparentistrue, all the lines of every bar will be visible.Shaded
Surfaces: When
Shadedistrue, JClass Chart 3D displays the data as a flat shaded surface in a 3D view with a Z-axis. The surface color is controlled with theshadedTopColorand theshadedBottomColorproperties (not currently available in the Java 3D API version of JClass Chart 3D).Bars: When
Shadedistrue, JClass Chart 3D draws each bar as a solid bar. All bars with a value greater than or equal to the origin of Z-axis will be drawn using theshadedTopColor, while all bars with a value less than the origin will be drawn using thesurfaceTopColor.The following code snippet shows setting these properties:
JCElevation elevation=c.getDataView(0).getElevation();
elevation.setMeshed(true);
elevation.setShaded(true);
elevation.setTransparent(false);
3.1.2 JCContour: Contoured and Zoned Plots
The
JCContourclass deals with information about contours and zones. Two of its properties areContouredandZoned. Both default tofalse.Contoured
Surfaces: When
Contouredistrue, JClass Chart 3D examines the distribution of the data, using theJCContourLevelsclass, and draws contour lines demarcating each of the contour levels. The contour line style, thickness, and color are controlled with thecontourStylesproperty.Bars: When
Contouredistrue, JClass Chart 3D examines the distribution of the data, using theJCContourLevelsclass, and draws contour lines around the bars, demarcating each of the contour levels. The contour line style, thickness, and color are controlled with thecontourStylesproperty.Zoned
Surfaces: When
Zonedistrue, JClass Chart 3D examines the distribution of the data, using theJCContourLevelsclass, and fills each level with a solid color. (UnlessMeshedistrueandShadedisfalse, in which case the fill color is used to draw each level's mesh lines.) The color for each level is specified with thecontourStylesproperty.Bars: When
Zonedistrue, JClass Chart 3D examines the distribution of the data, using theJCContourLevelsclass, and fills each level within each bar with a solid color. (UnlessMeshedistrueandShadedisfalse, in which case the fill color is used to draw each level's mesh lines.) The color for each level is specified with thecontourStylesproperty. IfzoneDataSourceis supplied to the data view, each bar is filled with a solid color. Otherwise, the bar is segmented by height according to the contour levels.
3.2 Chart Types
The following table shows the 15 basic graph types:
GraphChart Type
Meshed
Shaded
Contoured
Zoned
Surface Example
Bar Example
Comments
Displays surface and bars in a flat shade. Top and bottom colors may be set.
Contour lines are automatically drawn between distribution levels in the data.
Zoned1.
Similar to Contoured, except that each distribution level is displayed in a solid color.
Draws surface as a mesh and bars in outline. Surface and bars are flat shaded.
Displays surface as a mesh and bars in outline. Also draws contour lines along borders between distribution levels in the data.
Displays surface as a mesh and bars in outline. Uses zoning colors for mesh and bar outlines.
Displays a flat-shaded surface or bars with contour lines superimposed.
Displays contour lines and flat shaded zone colors to demarcate levels in the data.
Similar to Shaded, Zoned, but with a mesh or bar outlines superimposed.
Similar to Meshed, Shaded, but contour lines are superimposed.
Similar to Shaded, Zoned, but contour lines are superimposed.
1In this release, Zoned is the same as Zoned and Shaded for bar charts. Application developers are urged to use the Zoned and Shaded combination for this view, since the interpretation of the Zoned combination may change in a future release.
3.3 Bar Charts and Histograms
When
chartTypeisBAR, the elevation data will be displayed as a bar chart (if grid data is supplied). Each data point will be represented by a single bar. The spacing between adjacent elements in the grid is honored.Bar Z Origin
Bars start from the z Axis origin, which can be controlled through
JCAxis' origin property. The default value of the origin is 0.0. WhenShadedistrue, bars that have values greater than the origin are rendered in theshadedTopColorproperty of theJCElevationclass. Negative bars (that is, bars with values less than the origin) are rendered in theshadedBottomColor.Bar Spacing
The amount of space occupied by a bar, as a percentage of the maximum amount possible, is controlled through the
xSpacingandySpacingproperties of theJCBarclass. The default is 80%. Setting it smaller results in thinner bars. Setting bar spacing to 100% (the maximum) results in bars that about one another.
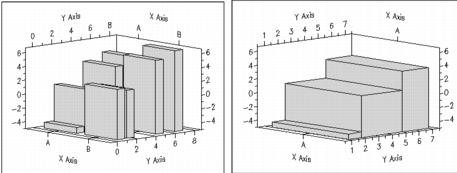
Figure 11 : Fixed Bar Chart with X-Spacing set to 1% and Y Spacing set to 100%.
Histograms
To display a histogram, set both the
xFormatandyFormatproperties ofJCBartoHISTOGRAM(default isFIXED). Thus, the X-axis and Y-axis can be independently switched between fixed and histogram formats.If the X-axis is switched to a histogram, each bar's left edge will be drawn aligned with corresponding X-values in the data. The width of each bar will be the distance between subsequent X-values in the data. Since the width of each bar is derived from the spacing between its neighbors, there is always one fewer bar along a histogram axis than there is if the same data is displayed along a fixed axis.
Histograms usually make good use of data whose grid values are not equally spaced. This gives control over spacing in the data grid.
Figure 12 : Fixed versus Histogram Display of Identical Data.
Grid Colors
If
ShadedistrueandZonedisfalse, the colors of the individual bars can be controlled. Normally, all bars with a value below the origin are colored withshadedBottomColor, and all others are colored withshadedTopColor. However, in some situations, it is useful to color a row, column, or individual bar in the chart with a distinct color.The
JCGridColorclass is used to specify the fill color of a group of bars, or of an individual bar. TheChart3dDataViewclass'gridColorsproperty stores a list ofJCGridColorobjects.The
JCGridColorclass has adataIndexproperty and acolorproperty. ThedataIndexis a reference to aJCData3dGridIndexobject which stores an index to a bar or group of bars. Thecolorproperty indicates what color to make the bars referenced by thedataIndex.An individual bar can be colored by specifying its indices in the
dataIndexobject. For example, to set the bar in the third X-data line, second point to red, set thexIndexproperty of thedataIndexto 2, theyIndexto 1, and the color toColor.red.To specify the color of an entire row of bars, set the other index to
JCData3dIndex.ALL. For instance, the entire fifth X line of bars is set to green by setting thexIndexproperty of thedataIndexto 4, theyIndextoJCData3dIndex.ALL,and the color toColor.green. To set the color of all the bars, set both thexIndexandyIndexof thedataIndextoJCData3dIndex.ALL.
Chart3dDataViewhas several convenience methods for manipulating the list ofJCGridColors. It hasaddGridColor()andremoveGridColor()for adding and removing grid colors. It also has afindGridColor()method which retrieves the first grid color that matches a given (xIndex, yIndex) index starting from the end of the list; this is what the chart uses to determine the color of a given bar. IffindGridColor()returns null, the bar color falls back to either theshadedTopColoror theShadedBottomColor.JClass Chart 3D's
Chart3dDataViewwill only maintain one entry per (xIndex, yIndex) combination. Whenever a second entry for the same indices is supplied, the first entry is removed. Later entries take precedence over earlier entries.The following code created the bar coloring in Figure 13:
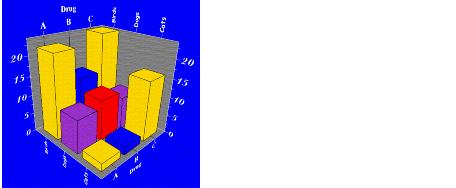
dataView.addGridColor(JCData3dIndex.ALL, JCData3dIndex.ALL, new Color(255, 208, 0));
dataView.addGridColor(1, JCData3dIndex.ALL, Color.blue);
dataView.addGridColor(JCData3dIndex.ALL, 1, new Color(176, 32, 240));
dataView.addGridColor(1, 1, Color.red);
Figure 13 : 3D Chart demonstrating numerous grid colors.
Note that even though the index of the bar at (1, 1) matches every entry in the list, the bar is colored red because it matches the last entry in the list.
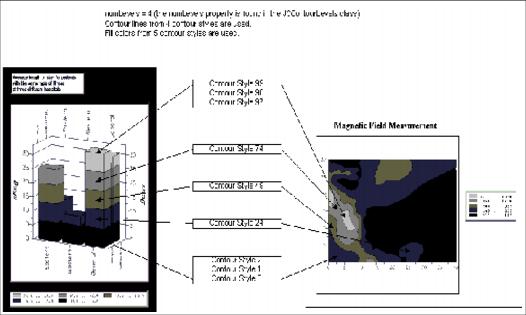
3.4 Contours and Zone Display
When
ContouredorZonedistrue, JClass Chart 3D marks each contour level from an array of 100 built-in contour styles.Each contour style contains information about the contour line style, width, pattern, color, and zone color (used to mark each level). Contour styles can be customized by an application. Please see Customizing Contour Styles, in Chapter 6 for details.
Contour Styles Used
JClass Chart 3D determines which contour style to use for a particular level automatically, evenly distributing the styles through the number of levels, as shown by Figure 14.
Figure 14 : A Sampling of Supplied Contour Styles Used as Needed.
By implementing the
JCContourMappinginterface and using thesetContour.Mapping()method of theJCContourclass, you can override the default level to contour style mapping.Also, by using the
JCContourLevelsclass, you can specify your own contour levels (such as an array of doubles). You can also use your own contour styles by setting thecontourStylesproperty of theJCContourclass. For further information, please see Advanced JClass Chart 3D Programming, in Chapter 6.Contour/Zone Projection
The
JCProjectionclass specifies information about the Contoured and Zoned projections on the top and bottom of the plot cube. For instance, you can use thesetContouredmethod to set the projection to be Contoured, and you can use thesetZonedmethod to set the projection to be Zoned.The
JCPlotCubefloor property is aJCProjectionthat indicates whether a projection should be drawn on the bottom of the plot cube. If either theContouredorZonedproperty of the floor projection istrue, a projection is drawn. Similarly, the ceiling projection controls what type of projection is drawn on the top of the plot cube.These properties do not depend on the values of
ContouredandZonedof theJCContourclass. However, any other property that affects contour generation or rendering affects projected contours/zones. Floor and ceiling projections are ignored in 2D graphs, bar charts, and scatter plots.
Figure 15 : Projecting Contours and Zones.
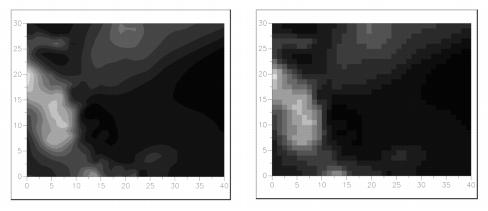
Zone Method
An application can control the method used to fill each zone region by leveraging the
ZoneMethodproperty of theJCContourclass. By default, JClass Chart 3D fills between each contour interval (ZONE_CONTOURS). When set toZONE_CELLS_AVERAGE, JClass Chart 3D fills entire cells in the grid based on the average of the four corners of the cell. Figure 16 illustrates the difference visually. When set toZONE_CELLS_CORNER, entire cells are filled using the value at the bottom left corner of the cell.Cell zoning produces a coarser-looking surface, but offers significant performance advantages over contour zoning. However, the visual difference between the two types of zoning diminishes with larger grids.
Figure 16 : Contour Zoning (left) and Cell Average Zoning (right).
3.5 Mesh Controls
Mesh Colors
Mesh colors are controlled by methods in the
JCElevationclass.The bottom and top colors of the mesh drawn when
Meshedistruecan be set withsetMeshTopColorandsetMeshBottomColor. They are both "black" by default. See Chart Colors, in Chapter 1 for details on setting colors.Mesh Filtering
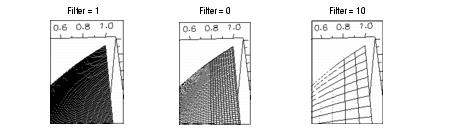
Methods in the
JCSurfaceclass control mesh filtering. This class contains properties that pertain to surface plots.The
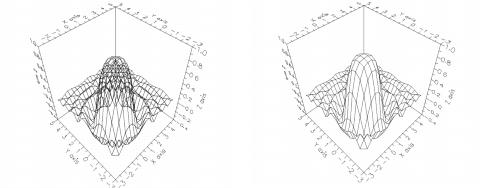
xMeshFilterandyMeshFilterproperties specify how the mesh is filtered before being displayed. By default, no filtering is performed. When set to 0, JClass Chart 3D automatically filters the mesh to provide a pleasing display, and changes the filter as the graph is scaled or the data changes.You can hard-code a mesh filter by setting these properties to any positive integer. For example, a value of 5 filters the mesh so that every 5th line is drawn.
Figure 17 : Effect of Mesh Filtering.
Hidden Mesh Lines
When
MeshedistrueandShadedisfalse, grid and contour lines that are obscured from view by intervening portions of the scene are not displayed by default. To display these lines, set theTransparentproperty ofJCElevationis totrue.
Figure 18 : Hidden line removal.
3.6 Surface Colors
The bottom and top colors of the shaded surface drawn when Shaded is true can be set with
shadedTopColorandshadedBottomColorof theJCElevationclass. By default the bottom color is "dim grey" or RGB(112,112,112) and the top color is "light grey" or RGB(211,211,211). See Chart Colors, in Chapter 1 for details on setting colors. Please note thatshadedTopColorandshadedBottomColorare currently not available for surfaces in the Java 3D API version of JClass Chart 3D.
3.7 Solid Surface
Setting the
Solidproperty ofJCSurfacetotruewill cause JClass Chart 3D to draw a skirt around the data, thereby joining the edge of the surface to a plane at the minimum Z value, as shown in Figure 19.
Figure 19 : Setting Solid Surface On and Off.
|
|