  
|
4
Programming JClass Chart 3D:
Scatter PlotsOverview
Three Basic Types of Scatter Plots
Controlling Symbol and Drop Line Style
All elements mentioned in this chapter refer to both the Java 2 API and the
Java 3D API, unless specifically noted.
4.1 Overview
As noted in the previous chapter, if grid data is provided to the chart via the
elevationDataSourceproperty of theChart3dDataViewclass, then surface, bar, or scatter plots can be drawn. The previous chapter dealt with surface charts and bar charts; this chapter deals with scatter plots.A scatter plot can be drawn using grid data, but the most usual way of providing data to a scatter plot is to provide the
elevationDataSourcewith point data. This type of data supports an arbitrary number of series, each containing an arbitrary number of points.An object can be a point data source if it implements the
Chart3dPointDataModel. When a point data source is passed to aChart3dDataViewobject, the data is extracted and stored in an internal point data object of typeChart3DPointData. This object can be retrieved via theelevationDataproperty ofChart3dDataView.More sophisticated point data sources can implement the
LabelledChart3dPointDataModel,EditableChart3dDataModel,HoleValueChart3dDataModel, and theChart3dDataManagerinterfaces.Please see Data Sources, in Chapter 5, for further details.
Each series can have a symbol that makes it distinct from that of the other series. When a chart of type
SCATTERis used in conjunction with grid data, each grid point will define a point in the scatter plot.
4.2 Three Basic Types of Scatter Plots
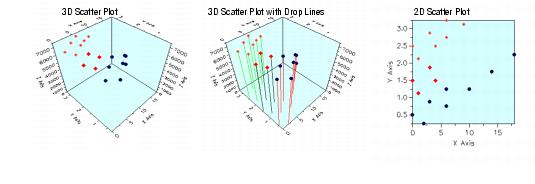
JClass Chart 3D offers three basic types of scatter plots: 3D scatter plots, 3D scatter plots with drop lines, and 2D scatter plots. (3D scatter plots with drop lines are not currently available in the Java 3D API version of JClass Chart 3D.)
Figure 20 : Scatter Plot examples.
Drop lines are lines drawn from each point on the 3D scatter plot down to the matching (x,y) position on the Z-axis origin of the plot cube. The drop line joins the point (x, y, z) to the matching point (x, y, origin). Drop lines are not used for 2D scatter plots. To draw drop lines on 3D scatter plots, set the
dropLinesproperty of theJCScatterclass totrue.2D scatter plots use only the X- and Y-values, and ignore the z components. They are "flat" charts. These plots are created by setting both the meshed and the shaded properties of the
JCElevationobject tofalse.
4.3 Controlling Symbol and Drop Line Style
4.3.1 Point Data
The style of symbols and drop lines used in scatter plots is determined on a per series basis. The
chartStyleproperty of theChart3dPointSeriesspecifies the line and symbol style information for a series.A list of
Chart3dPointSeriesobjects can be obtained from the series property of the internal point data object. This object, of typeChart3dPointData, can be retrieved via the data view'selevationDataproperty.Here is a code sample that changes the line style of the third series of a scatter plot. This code sample assumes that a point data source has already been set on the data view.
Chart3dPointData pointData=(Chart3dPointData)dataView.getElevationData();
ArrayList series=pointData.getSeries();
Chart3dPointSeries pointSeries=(Chart3dPointSeries)series.get(2);
JCChartStyle chartStyle=pointSeries.getChartStyle();
chartStyle.setLineStyle(new JCLineStyle(2, color.blue, JCLineStyle.SOLID));Line pattern, color, and width are controlled by the chart style's
LineStyleproperty, and symbol color, size, and pattern by the chart style'sSymbolStyleproperty.
4.3.2 Grid Data
If either the
zonedorcontouredproperties ofJCContouraretrue, the symbol color and style, along with the dropline style, will be chosen through the appropriatecontourStylefor the contour level to which the point belongs.Note: This makes use of the
JCContourStyleclass'lineStyleandsymbolStyleproperties.If both
zonedandcontouredarefalse, the symbol color and style, along with the dropline style, will be chosen through thechartStyleproperty if the internalChart3dGridDataobject is associated with the grid data.
4.4 Chart Styles
In a scatter plot, how a data value looks when it is displayed (for instance, color, line pattern, symbol style, line thickness, and so forth) depends on the chart style that has been defined for that data value. For example, the values in the third series of data will be rendered on screen using the chart style associated with the third series of the point data.
4.4.1 Default Chart Styles
When a new
Chart3dPointSeriesobject is created, a defaultchartStyleis created that possesses default line and symbol styles. The defaults are cycled, so consecutive calls will return different chart styles. A user may choose to override these defaults.The
JCChartStyleclass has two main components: aJCSymbolStyleobject that stores symbol information and aJCLineStyleobject that stores line style information. For convenience, the user can either set or get thesymbolStyleorlineStyleproperties of theJCChartStyleclass, or the user can set the individualsymbolStyleorlineStyleproperties directly on thechartStyle.For example, the following line of code:
chartStyle.setLineWidth(2);will change the line width of the
chartStyle'slineStyleobject.The
JCChart3dStyle datastructure contains all the information about how a set of data will be represented graphically. The properties are broken down as follows:The following method will print out the symbol size being used for the series of data, and double it:
public void double SymbolSize (Chart3dDataView dataView, int seriesIndex)
{
Chart3dPointData pointData=(Chart3dPointData)dataView. getElevationData();
ArrayList series=pointData.getSeries();
Chart3dPointSeries pointSeries=(Chart3dPointSeries)series(seriesIndex);
JCChartStyle chartStyle=pointSeries.getChartStyle();
system.out.println("symbol size:"+chartStyle.getSymbolSize());
chartStyle.setSymbolStyle(2*chartStyle.getSymbolSize());
}
4.4.2 Grid Data
For grid data, the
JCSymbolStyleobject and theJCLineStyleobject that determine how each point is drawn are obtained from either aJCContourStyleobject or aJCChartStyleobject. See Grid Data, in Chapter 4, for more information.
|
|